
Observing
NOTE: If you are using the version 1 data collection software, you will want to follow those observing instructions.
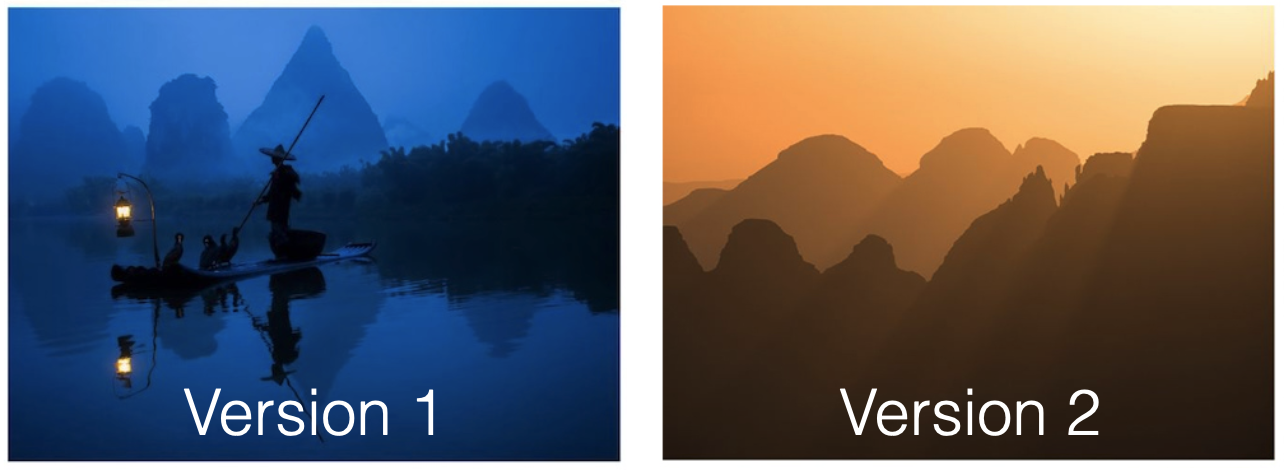
Or even better, upgrade to the latest version! If you’re unsure which version you’re using, have a look at your Raspberry Pi desktop image. If it looks like the left image below, you’re on version 1. The right image is version 2.
Planning
Galactic Navigation
If you’ve followed the telescope setup tutorial, you will now have a system that is ready to observe. The first step is to make a plan of where to point your CHART horn. You will need to know when the galaxy is visible in your location. Different parts of the Milky Way will be visible from different locations on Earth, depending on the time. The image below shows an artist’s rendition of the Milky Way, as would be viewed from above. The galaxy is divided into units of “Galactic Longutude”, with the center of the coordinate system at the sun. There are four Quadrants of Galactic longitude (I: 0 degrees to 90 degrees, II: 90 degrees to 180 degrees, III: 180 degrees to 270 degrees, IV: 270 degrees to 360 degrees). The II galactic quadrant is mostly only visible from the northern hemisphere, while the IV galactic quadrant is mostly only visible from the southern hemisphere. If you would like to make a rotation curve, only the I and IV quadrants are usable due to the geometry of the method we will use to calculate the rotation curve. This will be explained further in the analysis section. If you are just interested in detecting the 21-cm signal, you can point at any part of the galaxy you like.

Image Credit: NASA/JPL-Caltech/ESO/R. Hurt - http://www.eso.org/public/images/eso1339e/
There is also the consideration of Galactic latitude, or how far out of the disk of the Galaxy you are pointed. It is best to point as close to the plane of the Galaxy as possible, but the hydrogen distribution in the disk extends out to high galactic latitudes, so if you are slighly off you should still be able to see the 21-cm signal. Galactic latitude is demonstrated below:
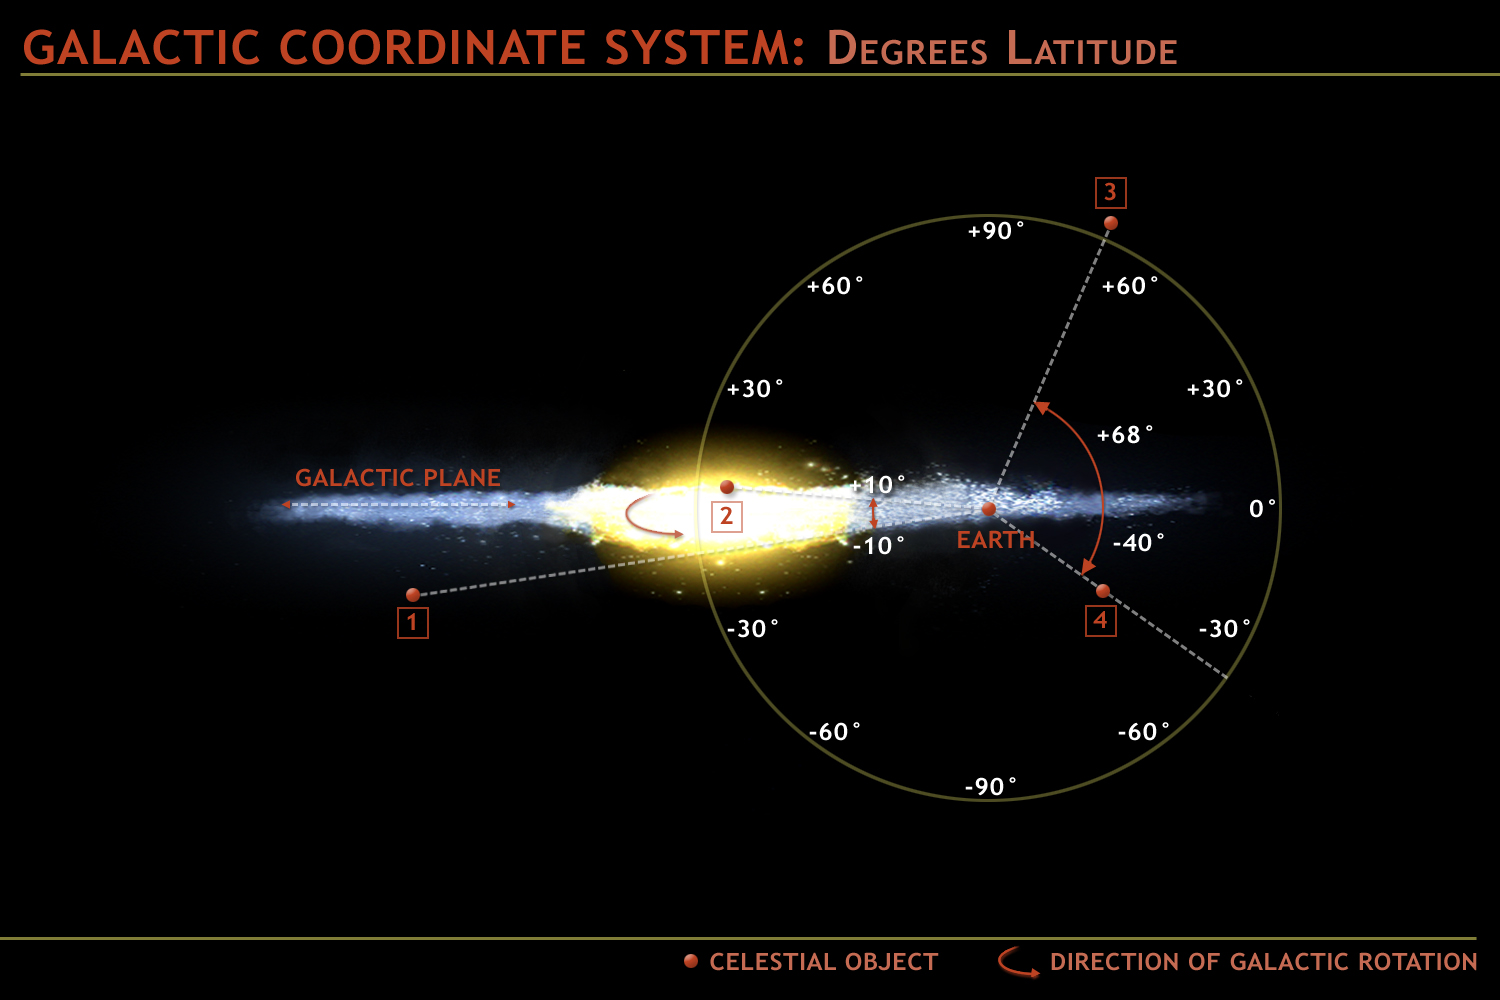
Image Credit: https://astronomy.ua.edu/undergraduate-program/course-resources-astronomy/lab-exercise-8-cosmic-distributions-and-the-galactic-ecology/1293-2/
To figure out where the galaxy is located at your location and time, we recommend using something like Stellarium to get a feel for how to find the galaxy, how the sky rotates, and what is overhead at different times. The CHART GUI also includes a caluclator for easy planning, described further below.
Stellarium Planning
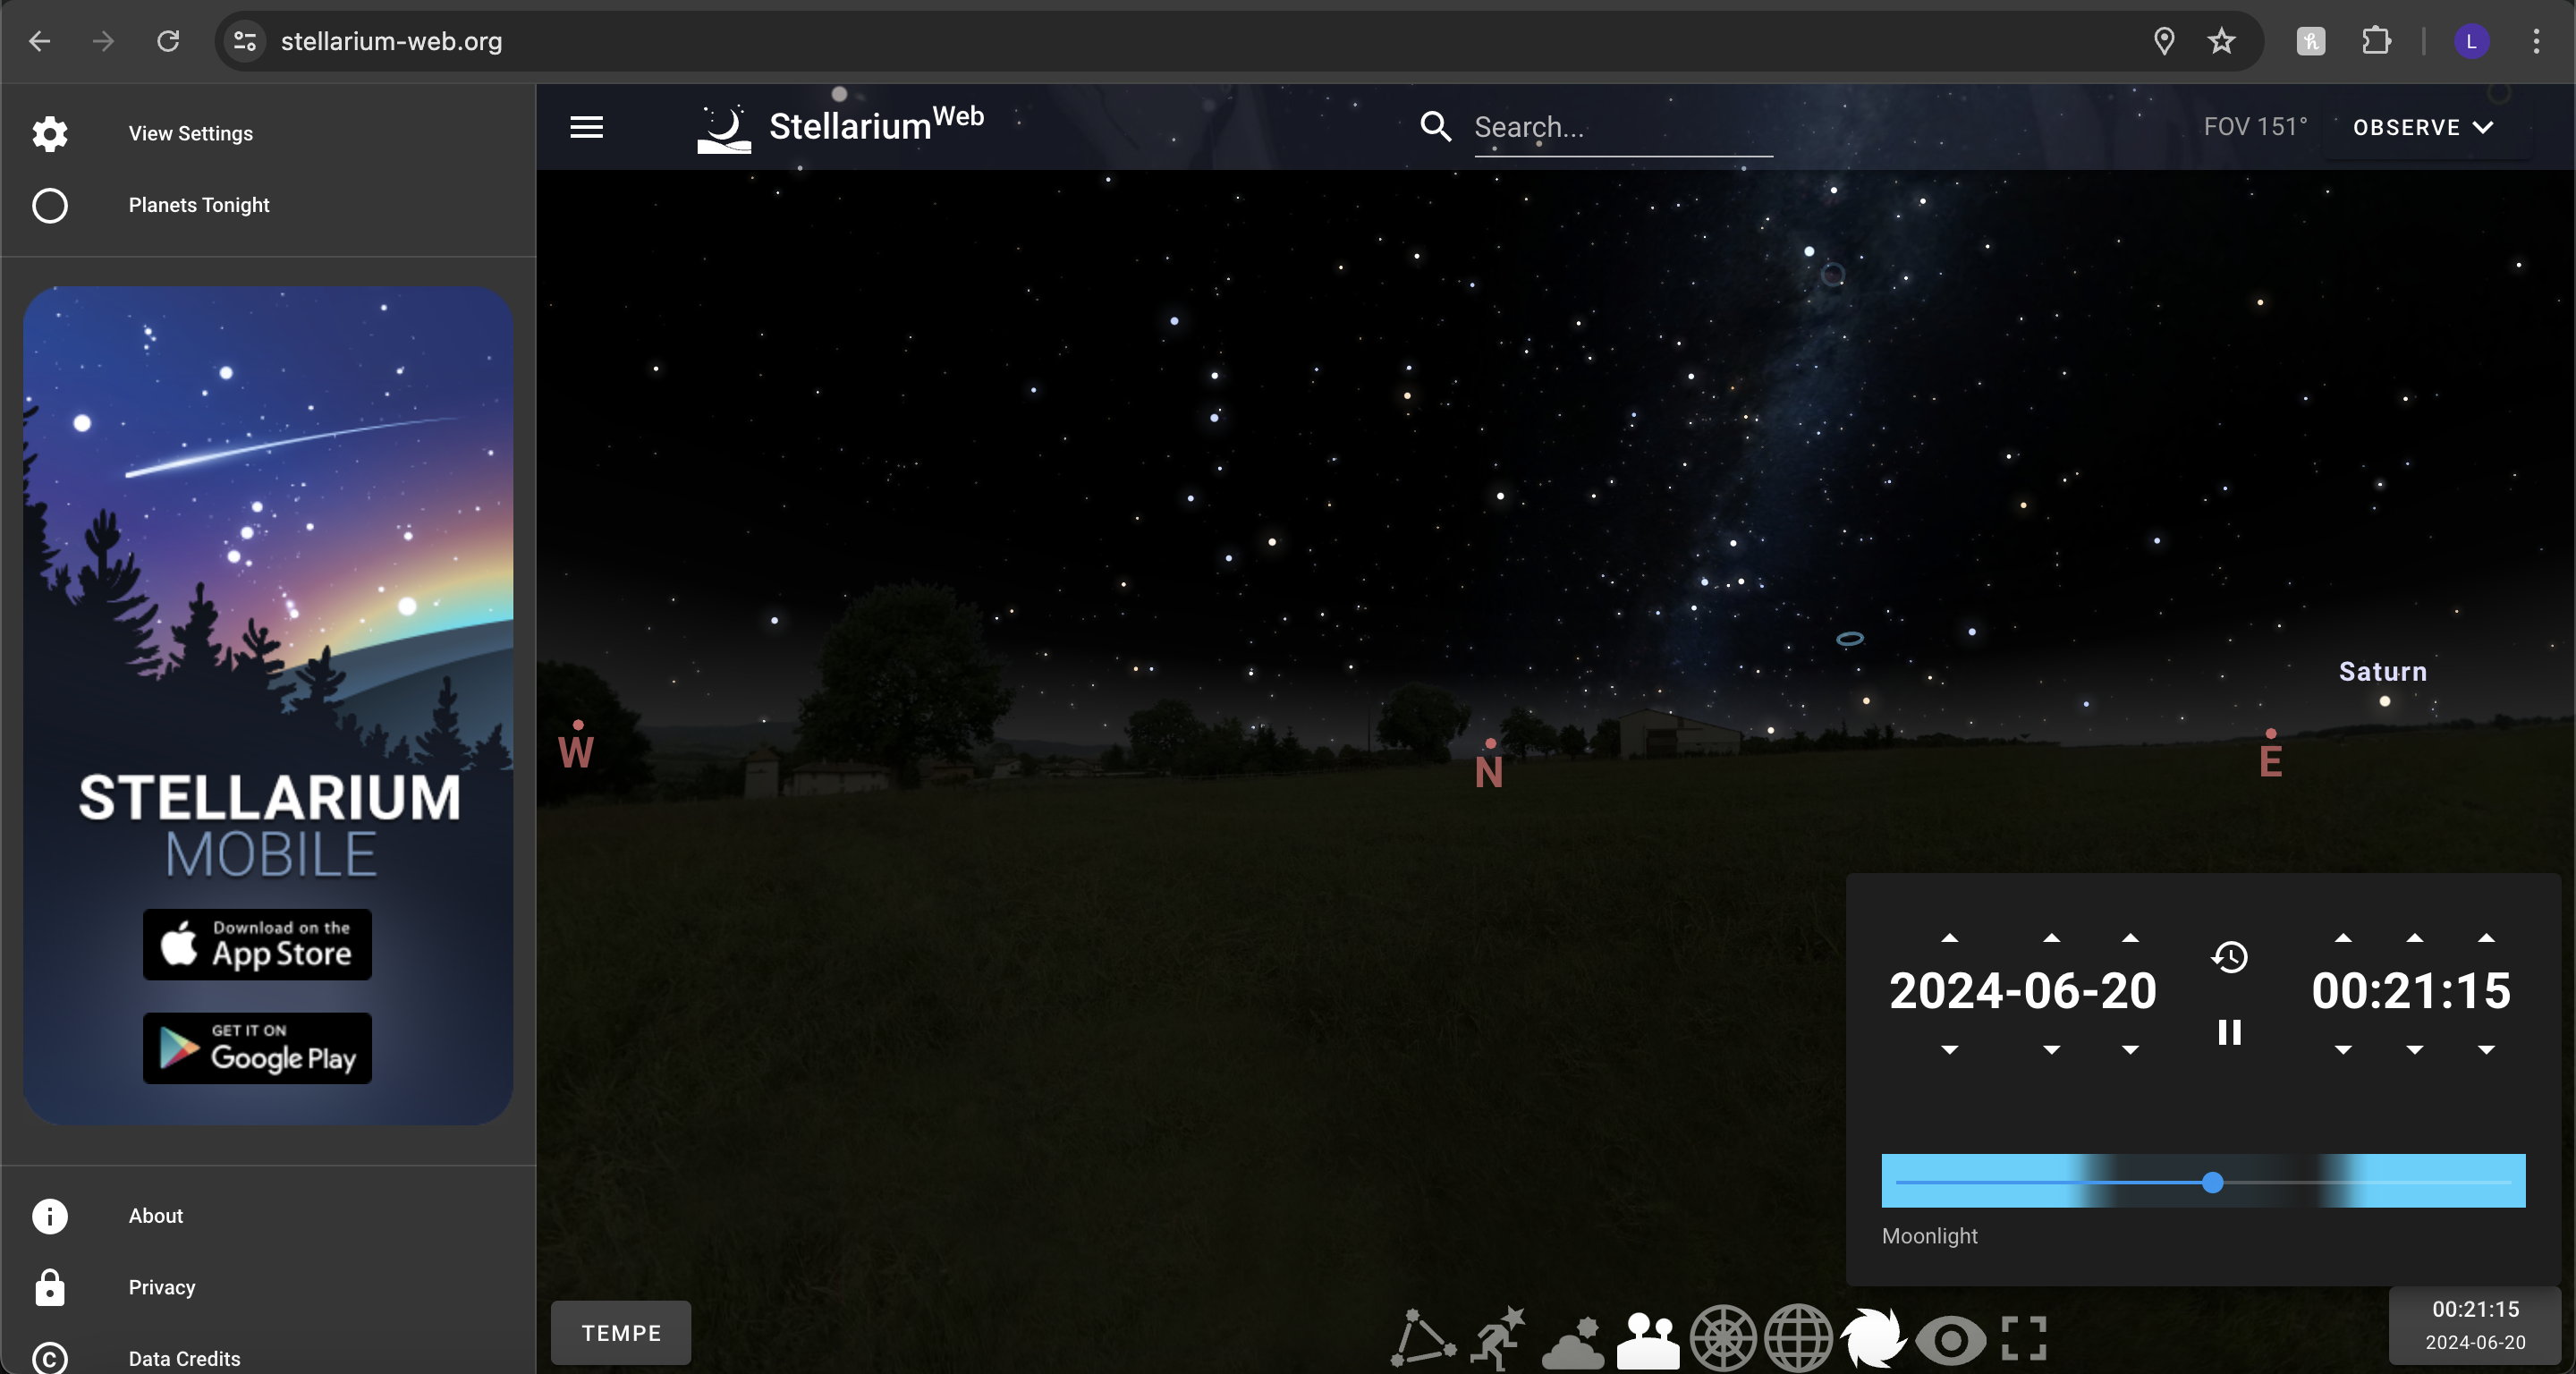
The Stellarium app or website will show what is in the sky at your location. We demostrate here with Stellarium web. Here is a quick view of the interface:
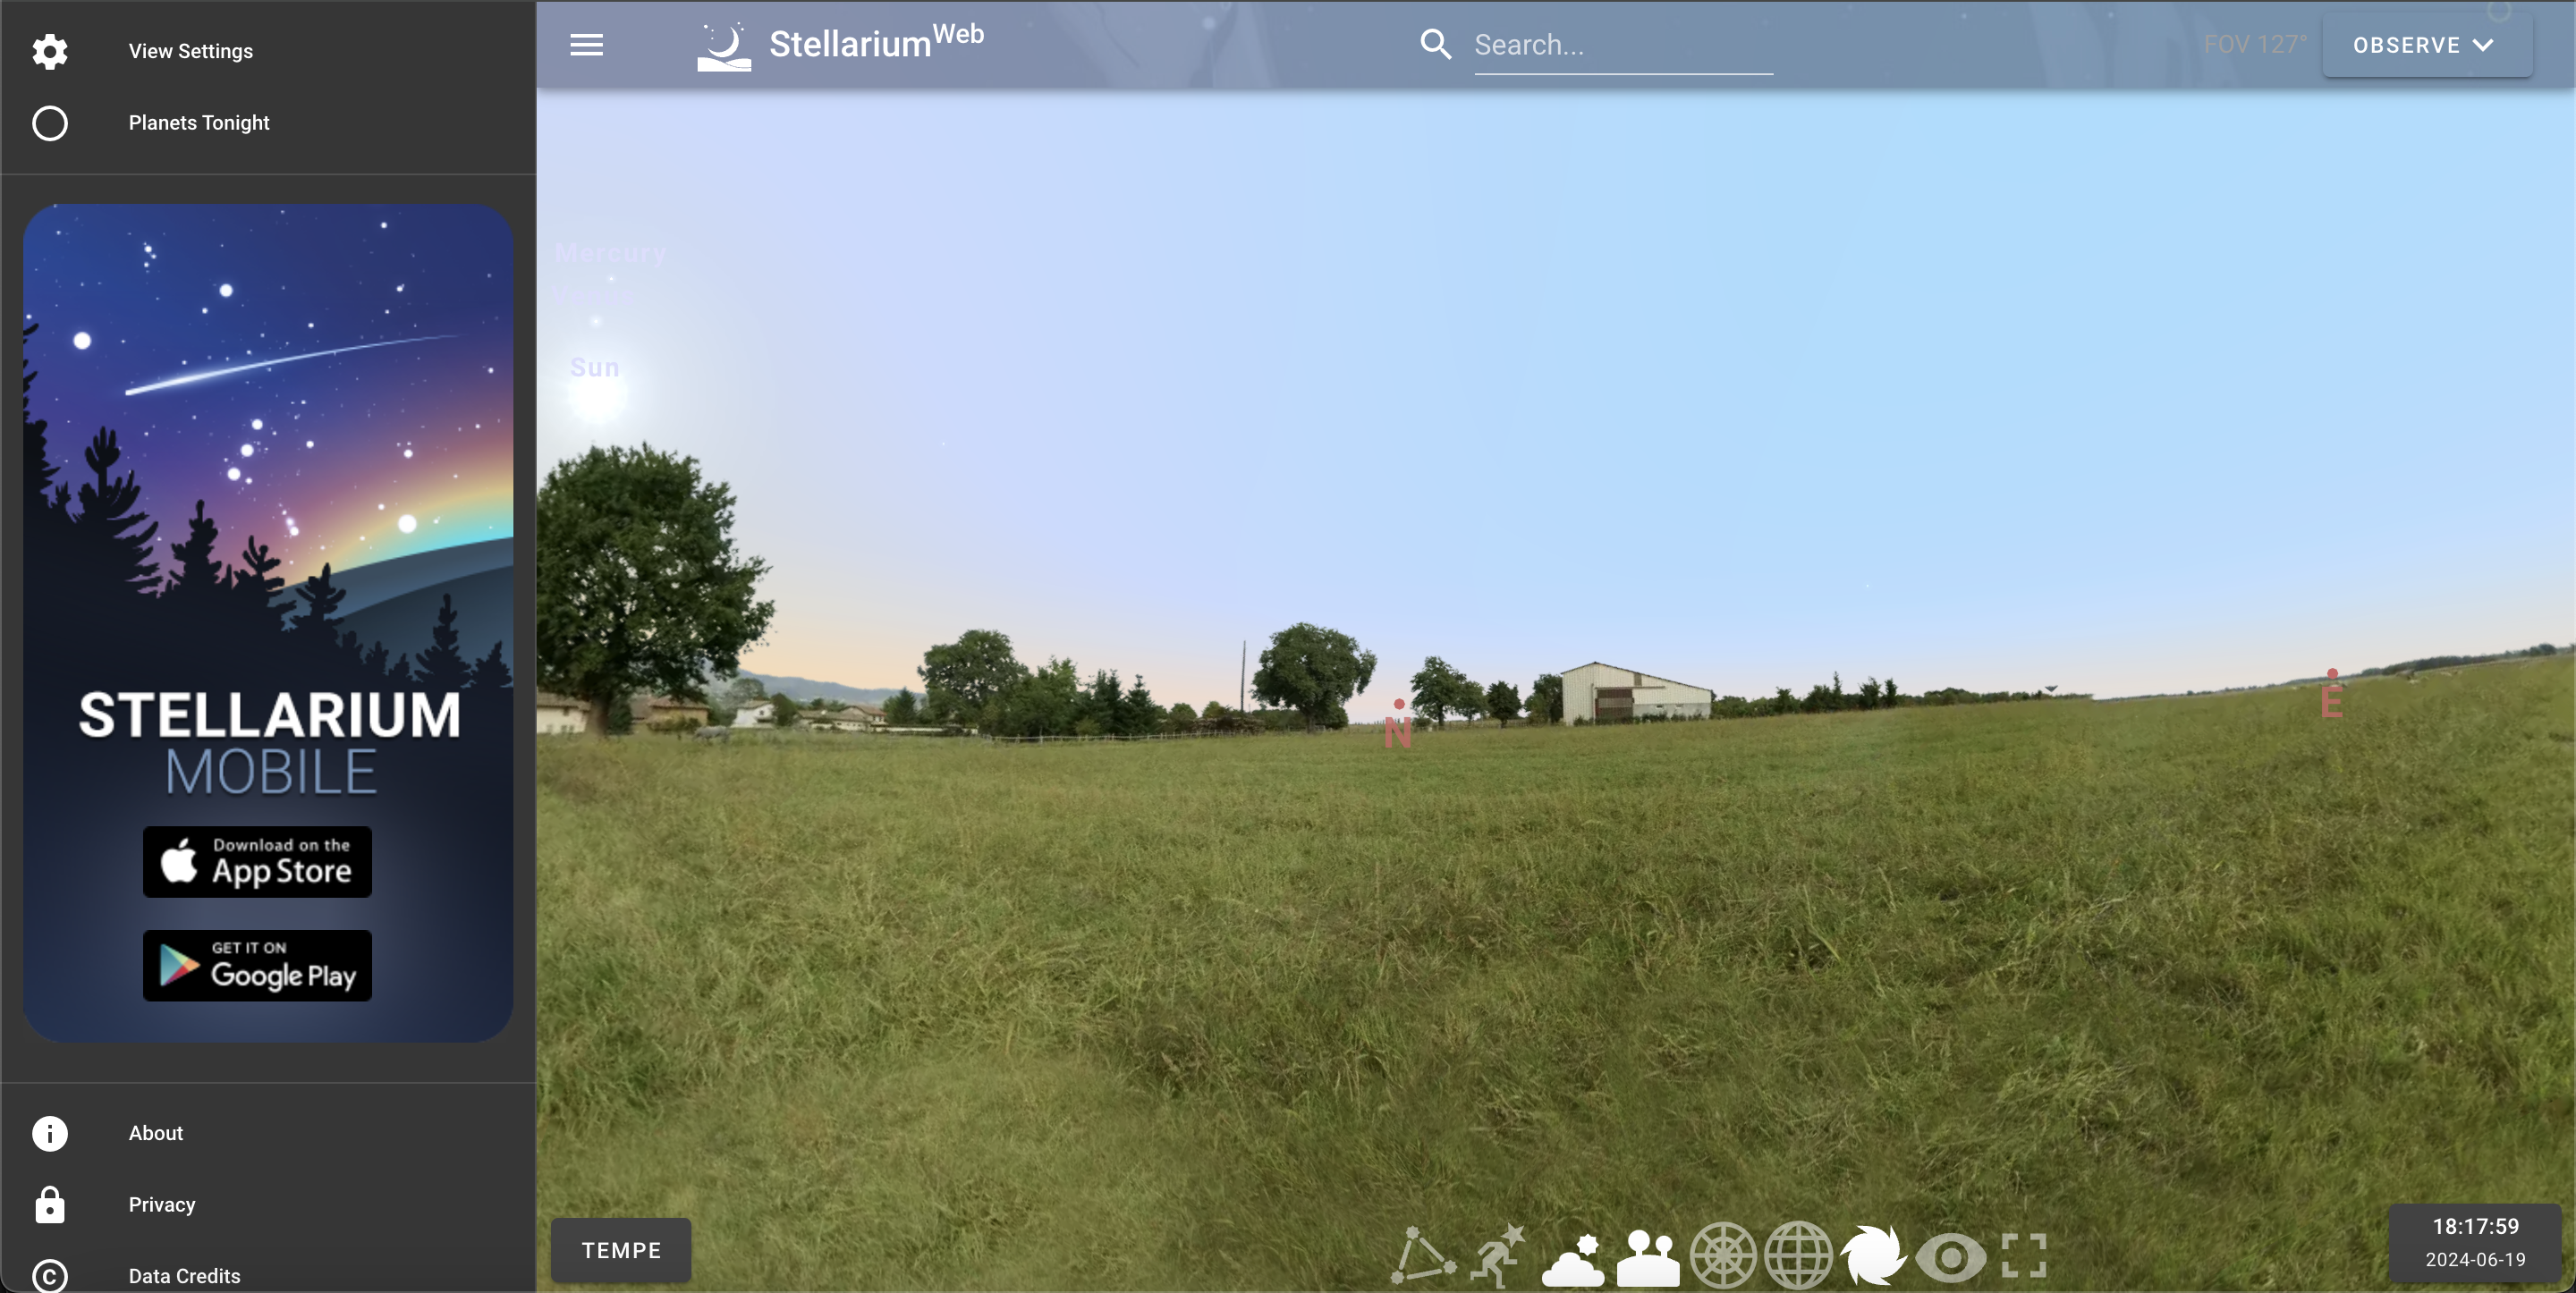
Make sure to change the location to your current location. NOTE: Stellarium uses your current actual location for its time system. So even if you set the location to elsewhere (e.g., if you want to analyze data taken in a different time zone), Stellarium will be showing the time in your current time zone, not at the location you choose.
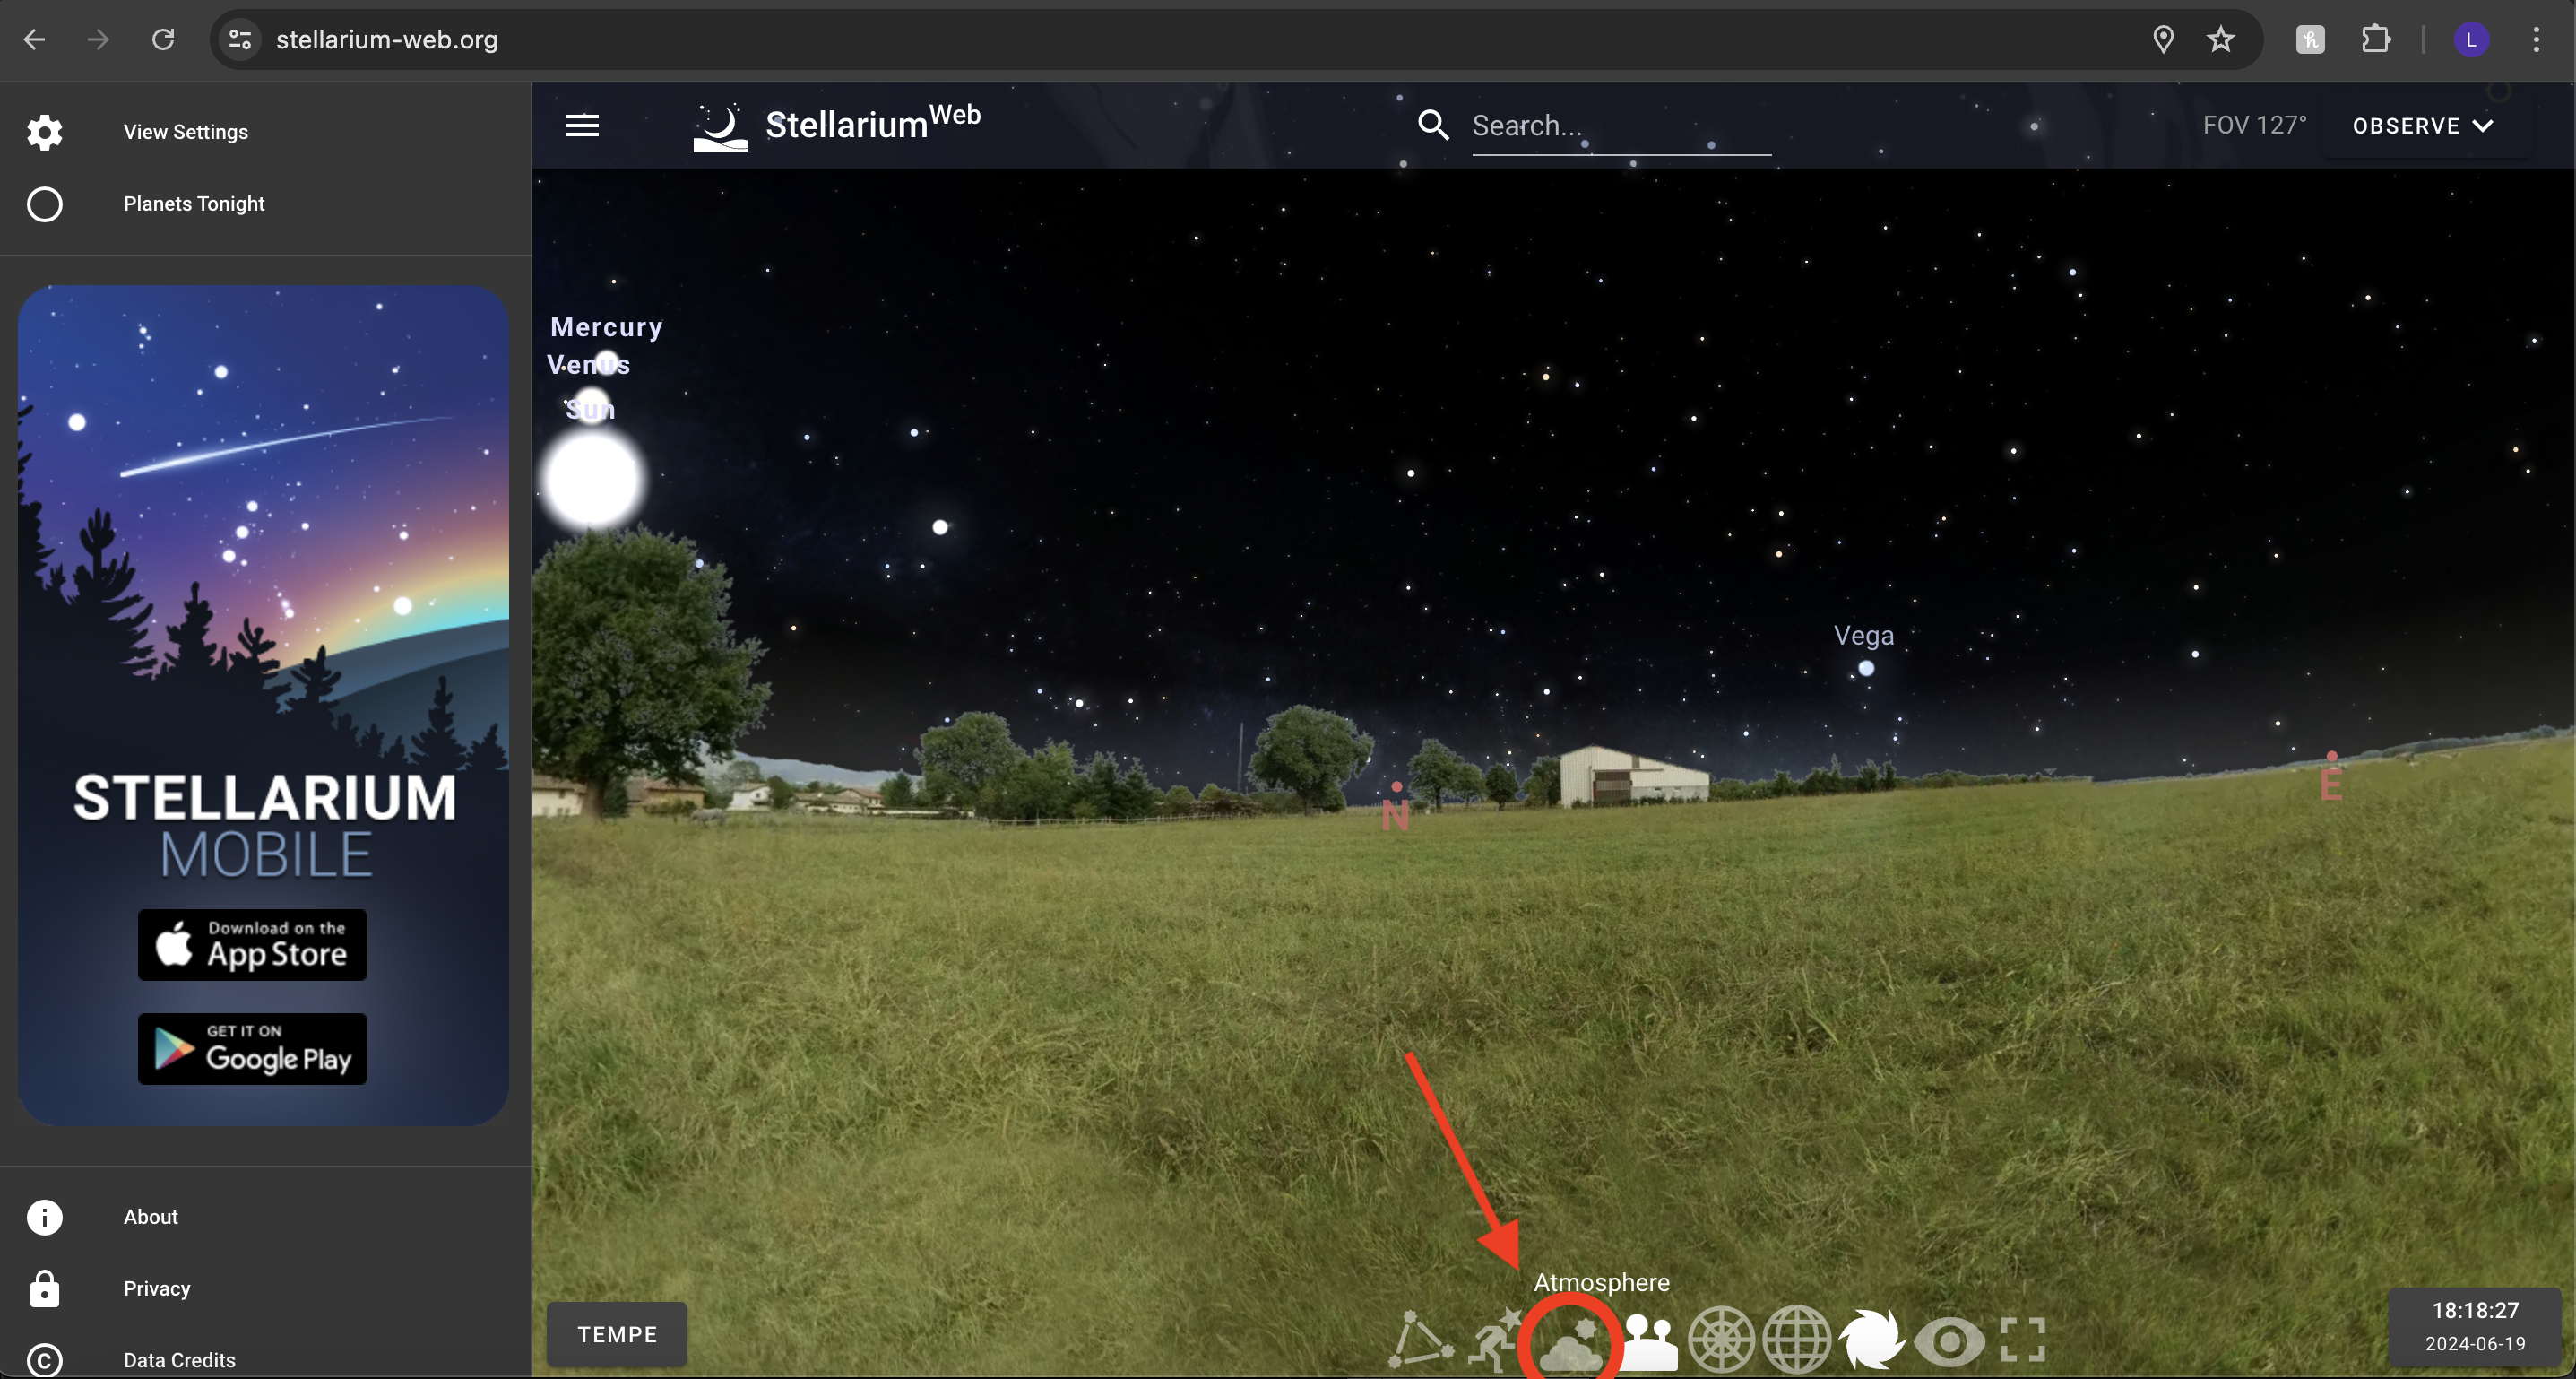
We recommend turning off the atmosphere with the button labelled “atmosphere” at the bottom. This will let you see where the Galaxy is during the day time as well as the night time. Fortunately, unlike optical astronomy, we can do radio measurements of the Milky Way during the day!
Using the bottom right button to scan through times, you can see when the Galaxy is visible from your location. It should pass overhead twice in a 24 hour period.
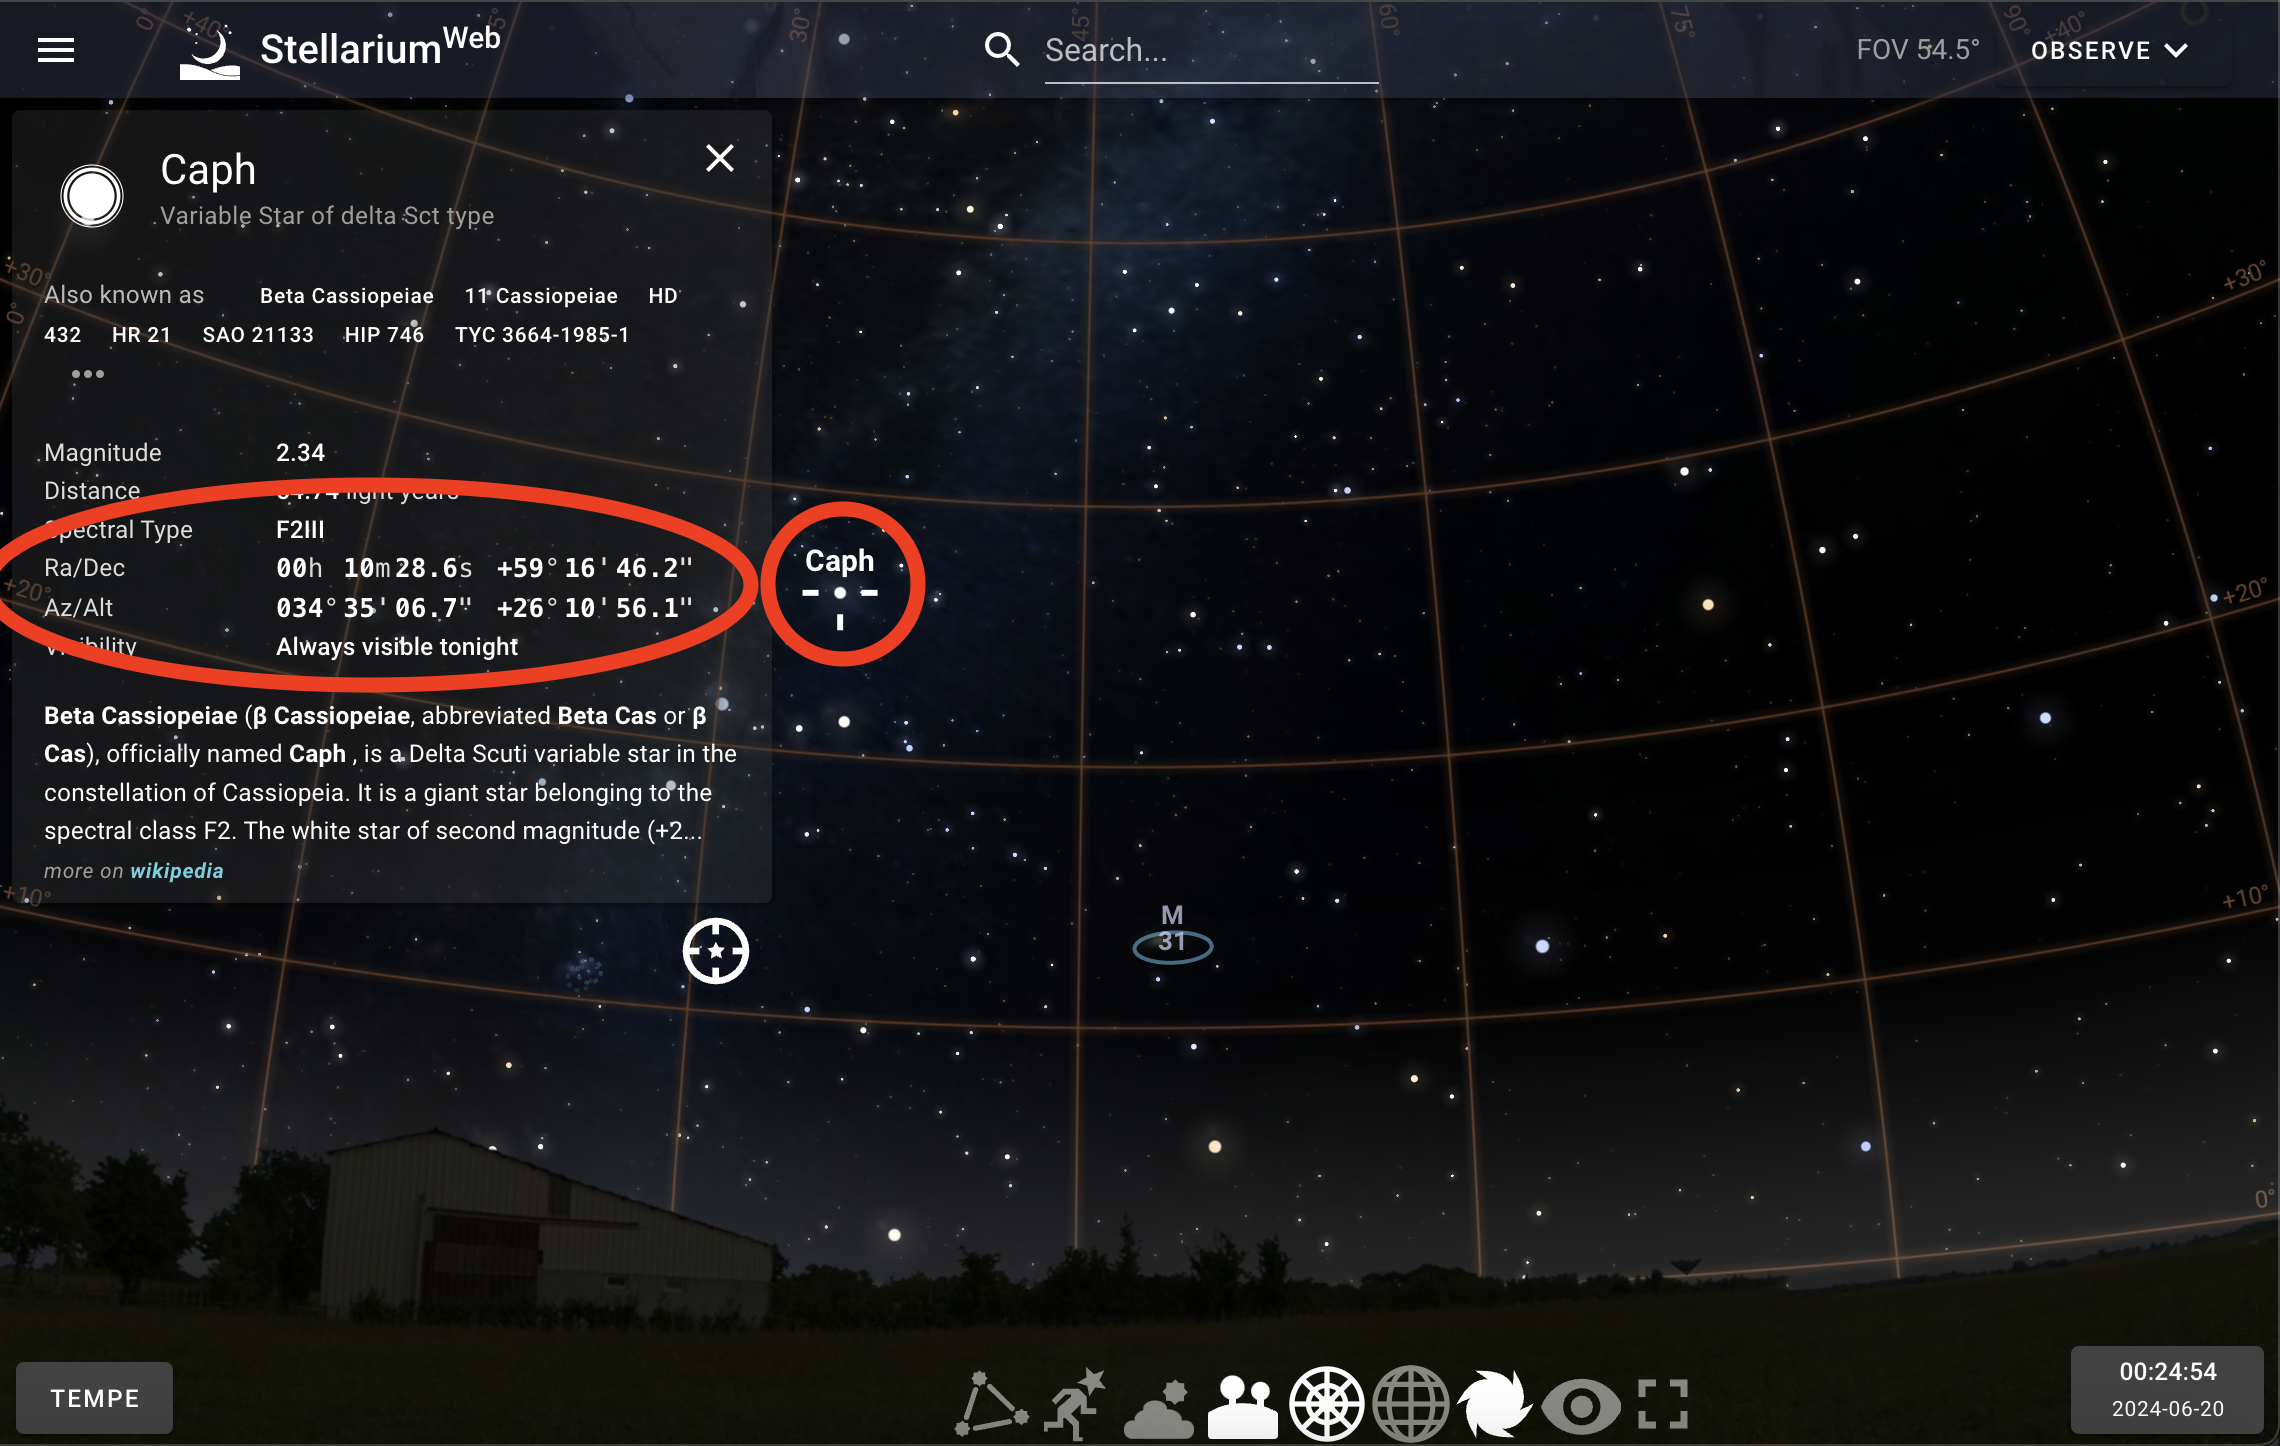
To check what part of the Galaxy you are seeing, you can click on an object within the galactic plane to get its sky coordinates. The desktop app version of Stellarium will give you galactic coordinates (Gal. long./lat.), but the web version or the mobile app version will only give you the RA and DEC (what we call “Celestial coordinates”, see here or the analysis tutorial for more information and then put it into a converter like this one to get the galactic coordinates. Here, we have clicked the object “Caph” which is within the plane of the Milky Way that we can see.
The other thing to consider is how many measurements to take. We have a resolution on the sky limited by the beam of the telescope, which is 25 degrees. This means that if you point at the galaxy at one set of coordinates, and then move say 10 degrees of galactic longitude later, there will be significant overlap in the gas collected, as there will be a 15 degree swath that is included in both measurements. If you want to scan the whole first quadrant, for example, it is reccomended to do it in steps of no smaller than 15 degrees.
Turn on the azimuthal grid next to the atmosphere button, and look at what Altitude and Azimuths you want to observe. These will guide you when you’re observing outdoors. You can use the same trick of clicking an object to get the exact Alt/Az. When you go out to observe, you can use a phone compass and either a protractor or phone level to figure out where to point the horn. The Azimuth should be findable with your compass, and the Altitude with the level. You may need to bring something to prop your horn up with if you’re holding it at an angle.
CHART GUI Planning
After getting a feel for the sky using an app like Stellarium, you may find it tedious to find go through the process of finding targets and converting targets to plan several observations.
To help streamline the process, the CHART GUI includes a planning tool.
On your pi, click the chart-observe icon on the Desktop to open up the GUI.
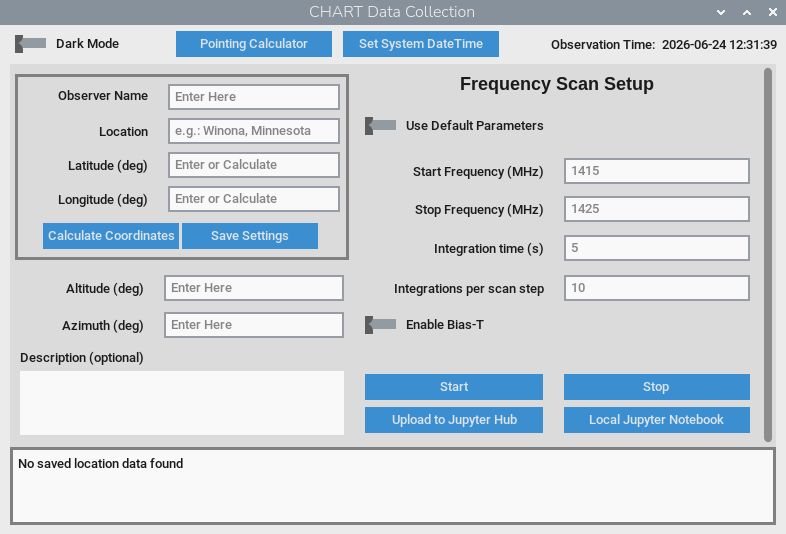
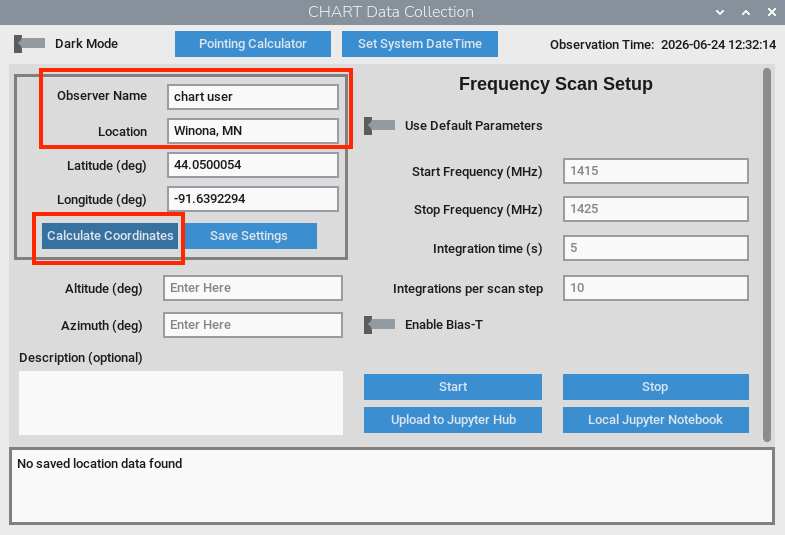
You will later use this same program for collecting data, but for now we will use the planner. First enter your name and location in the upper left box. Then click the “Calculate Coordinates” button to calculate your latitude and longitude (requires internet access). At this point you can click “Save Settings,” and your info will be auto-loaded next time you start the GUI.
Next click the “Pointing Calculator” button at the top of the window. A separate window should pop up with your latitude and longitude already filled out.
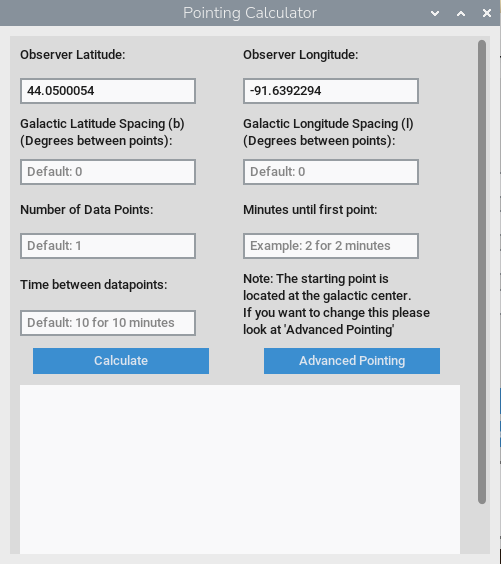
The main planner helps you plan out a series of pointings stepping up in Galactic Latitude and/or Galactic Longitude. Enter your desired spacing between points, number of pointings you’d like to acquire, number of minutes until your first pointing, and time between pointings. Click “Calculate” for the program to come up with an observing plan for you.
You can also click “Advanced Pointing” to access a couple more features. The first advanced feature is simply to set the starting Galactic Latitude and Longitude for the observation planning.
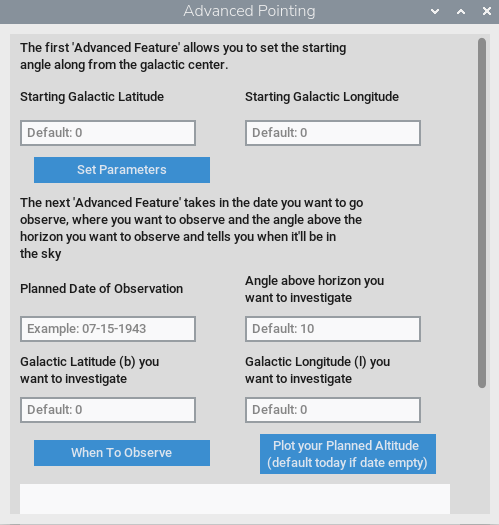
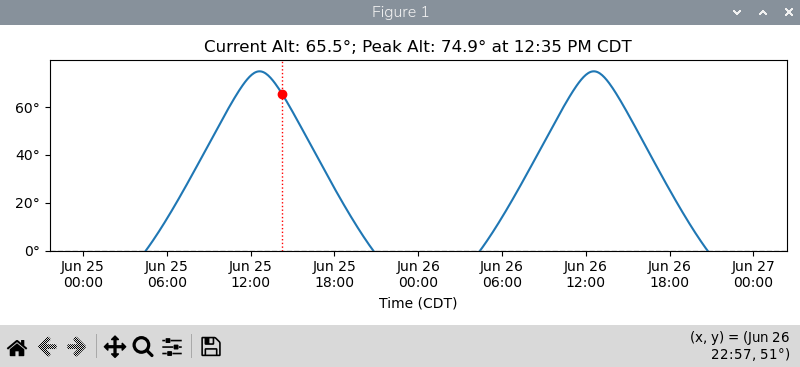
The last feature is to aid in determining when you may want to go out to observe a specific target. Choose the date, how high above the horizon you’d like to observe, and the Galactic coordinates of your target. The “When to Observe” button will give you details about the best times to observe, while the “Plot your Planned Altitude” button will generate a plot showing the altitude of your target over the course of a couple days.
Whether you use Stellarium or the CHART software, it’s a good idea to have a plan before you head out. We even provide observing sheets that we recommend using to keep track of your plan, then make notes when you’re out there.
Setup
Now, you’re ready to observe outside! The steps to set up your telescope are described below, and we also link to printable documents for convenience in the field. We recommend doing a practice setup in the comfort of your house/classroom/lab before heading out to the field. This setup assumes our baseline design outlined in the Telescope Construction tutorial.
The CHART Procedure document describes the setup and data taking steps.
The CHART observing sheet provides a handy template for keeping an observing log.
Here is a printable version of the procedure document if you’d like to have one handy.
Packing List
Essentials:
- Horn
- Amplifier and filter
- RTL-SDR and SMA cable
- Raspberry pi, mouse, USB-C cable for power
- Monitor, HDMI cable, USB micro cable for power
- Battery
- Tape, aluminum tape, foil
- Notebook, pen, observing sheets
- Phone (for determining pointing)
If needed and available:
- RF Explorer
- Table
- Garden stakes, lawn chair, boxes for propping up horn
- Tarp (to stay dry on wet grass)
- Sunscreen
- Bug spray (long pants and sleeves)
- Flashlight or headlamp
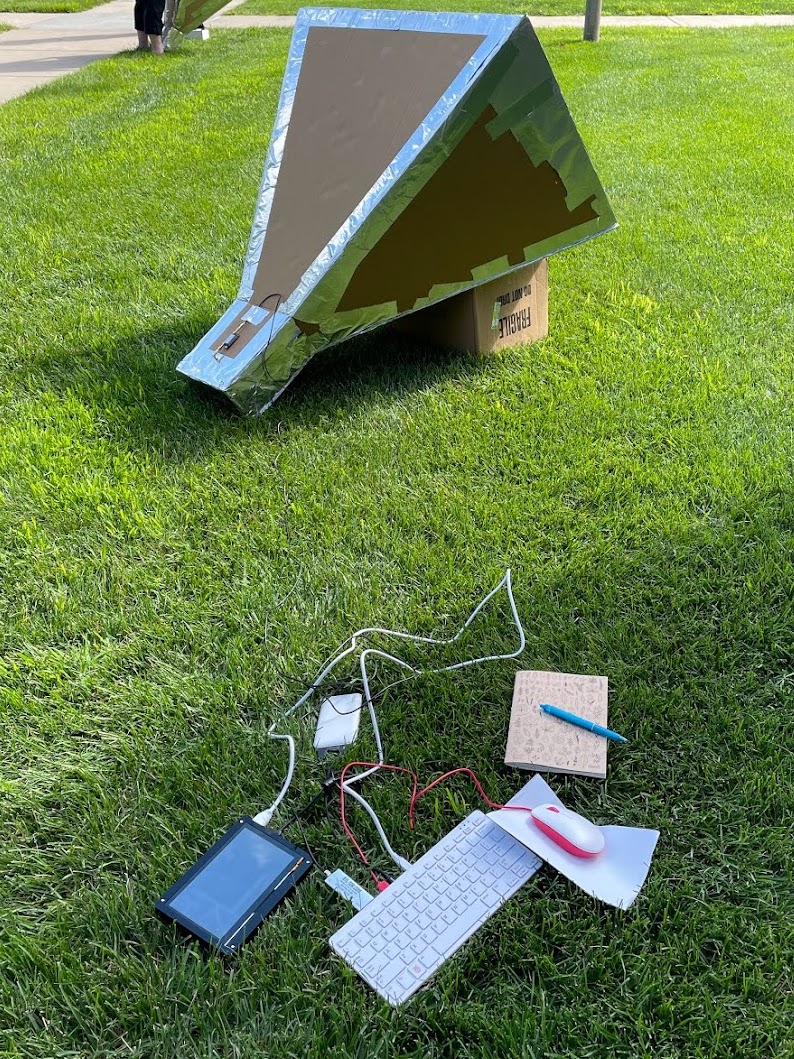
Assembly
- Place telescope on ground.
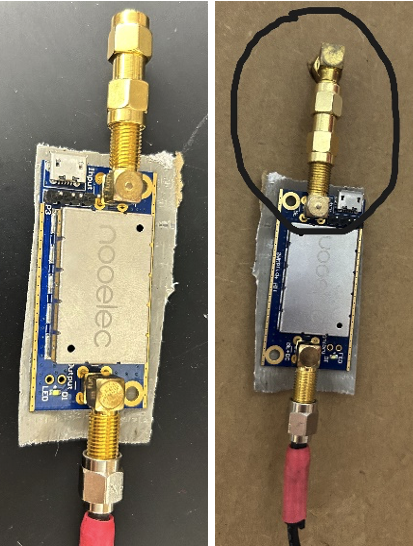
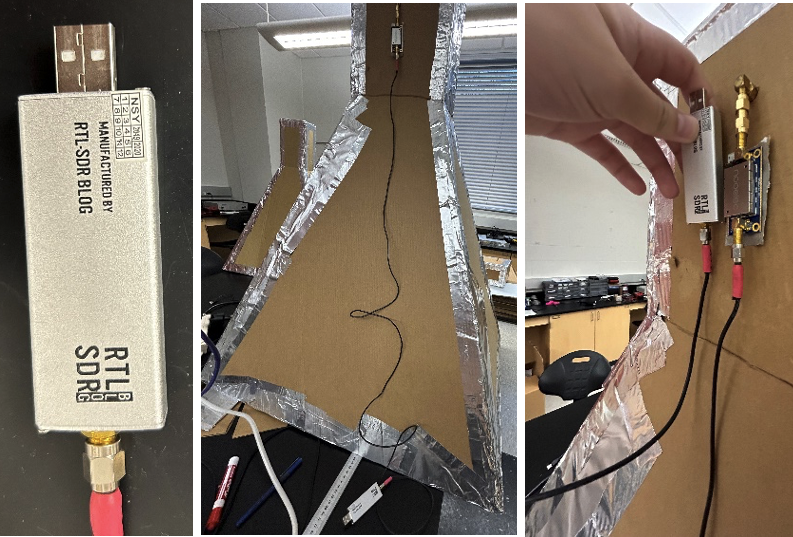
- Connnect the Nooelec amp and filter onto the horn by twisting the bolt.
If you are using the barebones amplifier (as we are in the photo below), use a piece of duct tape to cover the bottom of the circuit board. If the electrical connections come in contact with the foil on the horn, it will short the amp and potentiall break it.
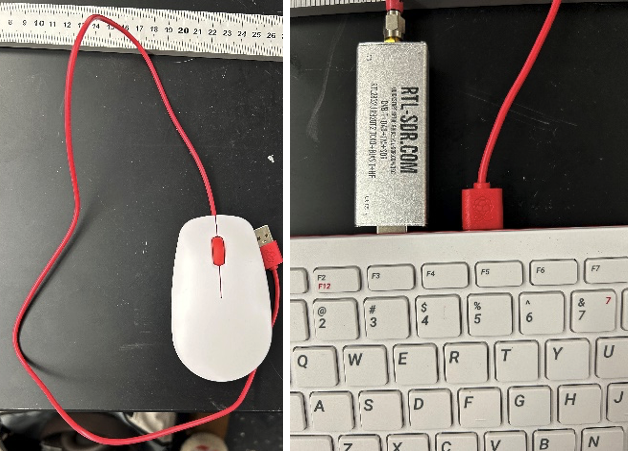
- Connect the Noelec amp and filter to the RTL-SDR using the SMA cable.
- Plug the RTL-SDR into the Raspberry Pi USB 2 port.
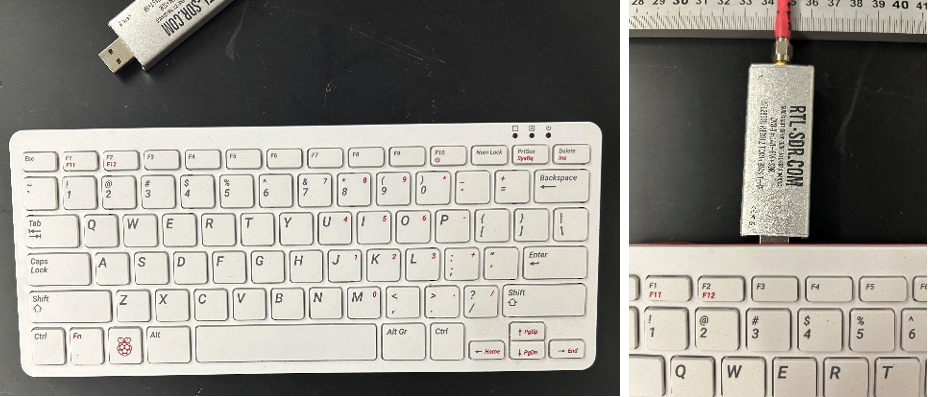
- Plug the mouse into the Raspberry Pi.
- Plug the small end of the HDMI cable into the Raspberry Pi and the large end into the monitor.
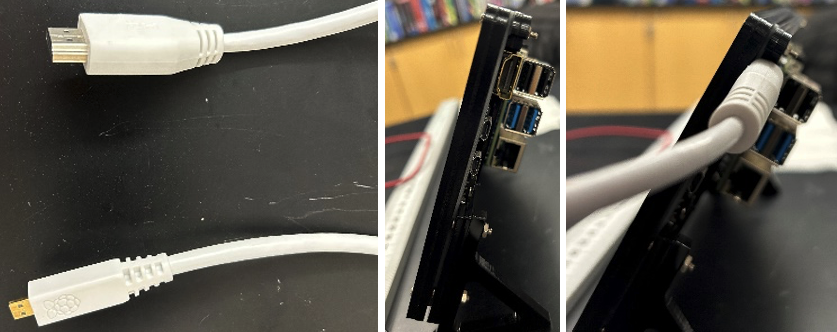
- Plug the small end of the USB-C cable into the Raspberry Pi where the power symbol is, and plug the large end into the battery.
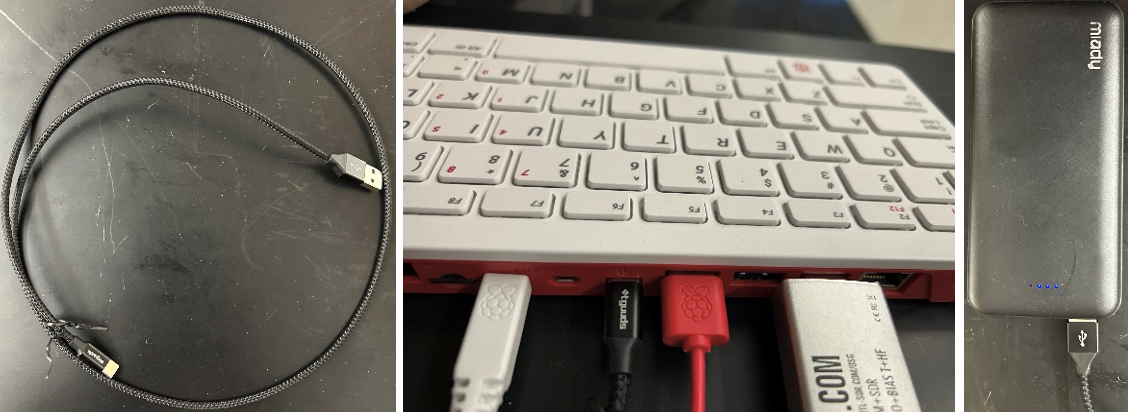
- Plug the small end of the USB micro B cable into the “power only” spot in the monitor, and the large end into the battery.
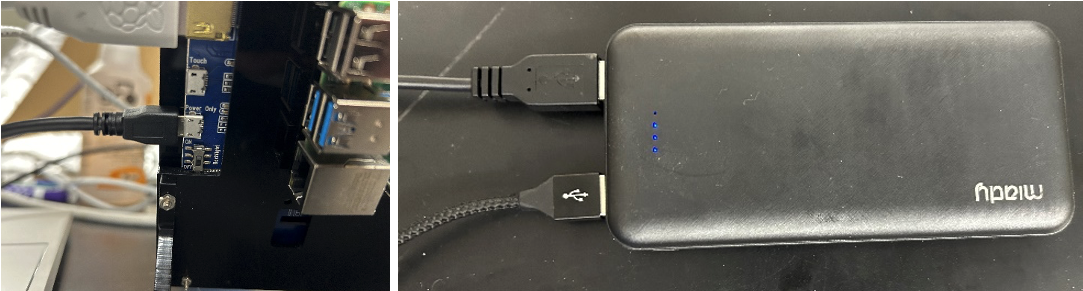
- Once everything is plugged in, the screen should light up and the Pi should boot up.
- Make sure your Pi and monitor are as far from the horn as you can get them. A few meters is far enough, but we have found that if they’re close they can cause interference with the data.
- Point towards desired location on sky, use compass and level apps on phone to guide.
Tips for measuring altitude and azimuth:- We typically use a compass and level app on our phones. These are built into the iPhone, Android users typically download an app. Whether using iOS or Android, the phyphox app works quite well and gives you great access to your phone’s sensor data.
- When measuring the altitude, place your phone flat on the top part of the waveguide - not the slanted horn panel. Make sure the angles make sense. Sometimes the phone will display roll instead of pitch, so you want to be sure you’re seeing the right thing.
- When measuring azimuth (i.e., compass bearing), place the top edge of the phone against the top panel of the horn and hold the phone flat. Again, double check that numbers are reasonable.
- Your compass will typically measure magnetic North unless you tell it you want True North (a setting in iOS). This is not typically a huge factor unless you live particularly far north or south.
- Remember to log your measured Altitude and Azimuth in the data collection GUI.
- Hold telescope throughout the data collection.
Taking Data
We will use the same Graphical User Interface (GUI) that we used for planning, now for taking data.
- Open the chart-observe file on the Pi’s desktop.
- If you used the GUI for planning, and saved your settings, it should auto-populate your location. If not, go ahead and put in your name and location.
- Without internet access, a Raspberry Pi doesn’t know what time it is. So if the system time is off, use the button at the top of the window to “Set System DateTime.” You should only need to do this once on a fresh boot-up. But it doesn’t hurt to keep an eye on it if you are observing for an extended time.
- Enter the parameters you want to use for taking data.
- Your altitude and azimuth should be measured based on where your horn is actually pointed, not necessary exactly what was planned.
- A short description will help you remember what you were doing with the observation.
- The Frequency Scan parameters will determine the range of frequencies observed, as well as how much time is spent on each frequency tuning. You can use the default parameters by setting the slider at the top.
- The Enable Bias-T option should only be used if you know for sure that you are using a bias-T. If you are following this tutorial exactly, then Bias-T SHOULD be on. This is what turns on the LNA, which should have a bright white light on when taking data.
- A bias-T is a small bit of circuitry used to power an amplifier on the same cable as the radio signal.
- If you are using the Nooelec filter and amplifier we recommend, then you do have a bias-T and should enable this setting.
- When you enable the bias-T you will see a warning message. You can close this window pop-up and continue once you confirm you do want it enabled.
- Click “Start.”
- The window at the bottom will show the status of the scan.
- Be sure to note down the directory for your run. It should look something like
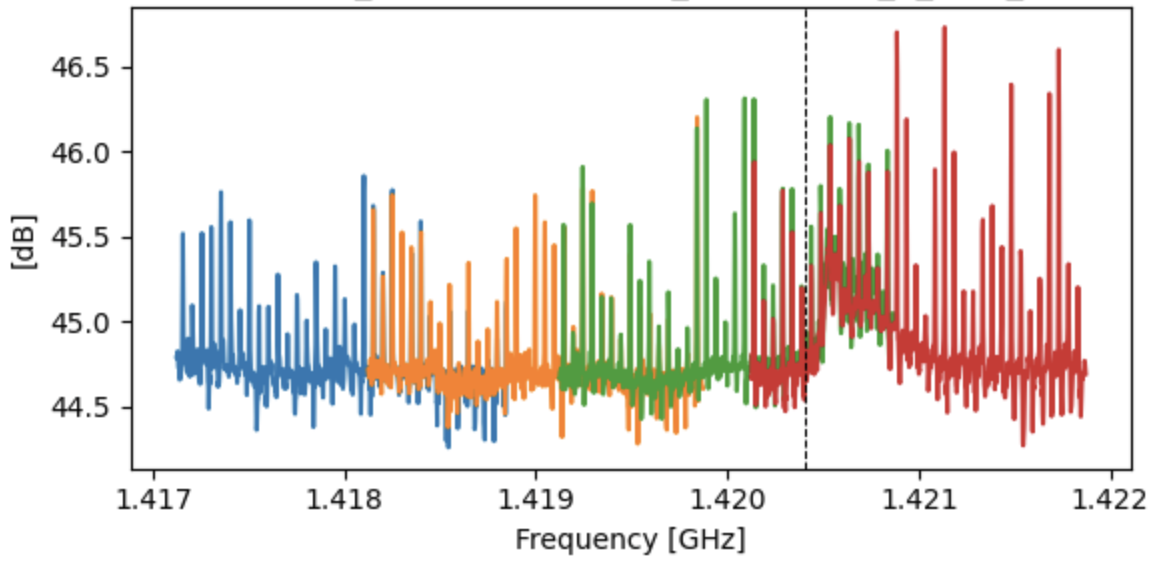
/home/pi/data/YourName_DateTime. - When your scan is complete, a graph should pop up showing a rough analysis of the data you just took. If all went well, you should be able to see a 21cm emission line somewhere in the shaded green region.
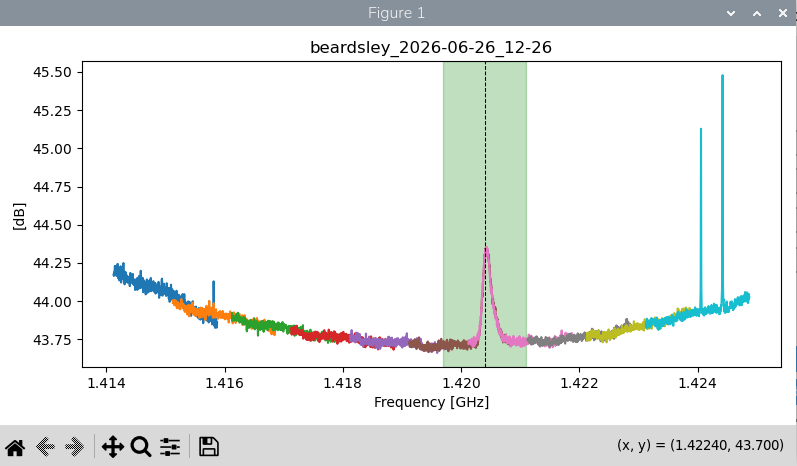
- If you missed your data directory, it should be the title of the plot that popped up.
- Repoint your horn, update the observing parameters, and keep exploring the galaxy!
When you’re done collecting data, and probably when you’re back in the comfort of the indoors, you’ll want to procede to our Analysis section.
When things aren’t quite right
Sometimes things don’t work right away, and that’s ok! Below we’ve compiled a few things to check and troubleshoot. Of course you can always reach out to the CHART mailing list, or reach out to the mentors directly if you need additional help.
- Tighten all the SMA connections. They should be finger tight (and not much more than that).
- Move the electronics as far from the horn as you can, especially the Pi and monitor. The plot below is an example of what data might look like with interference from the Pi and monitor. It looks rough, but actually not the end of the world! It can be cleaned up a lot in the analysis step.
- Consider your surroundings. Radio waves go right through clouds, but buildings, cars, trees, bluffs, etc are another matter. Buildings especially can cause all kinds of crazy reflections and offer their own interference that spoils an observation.