Analysis Tutorial
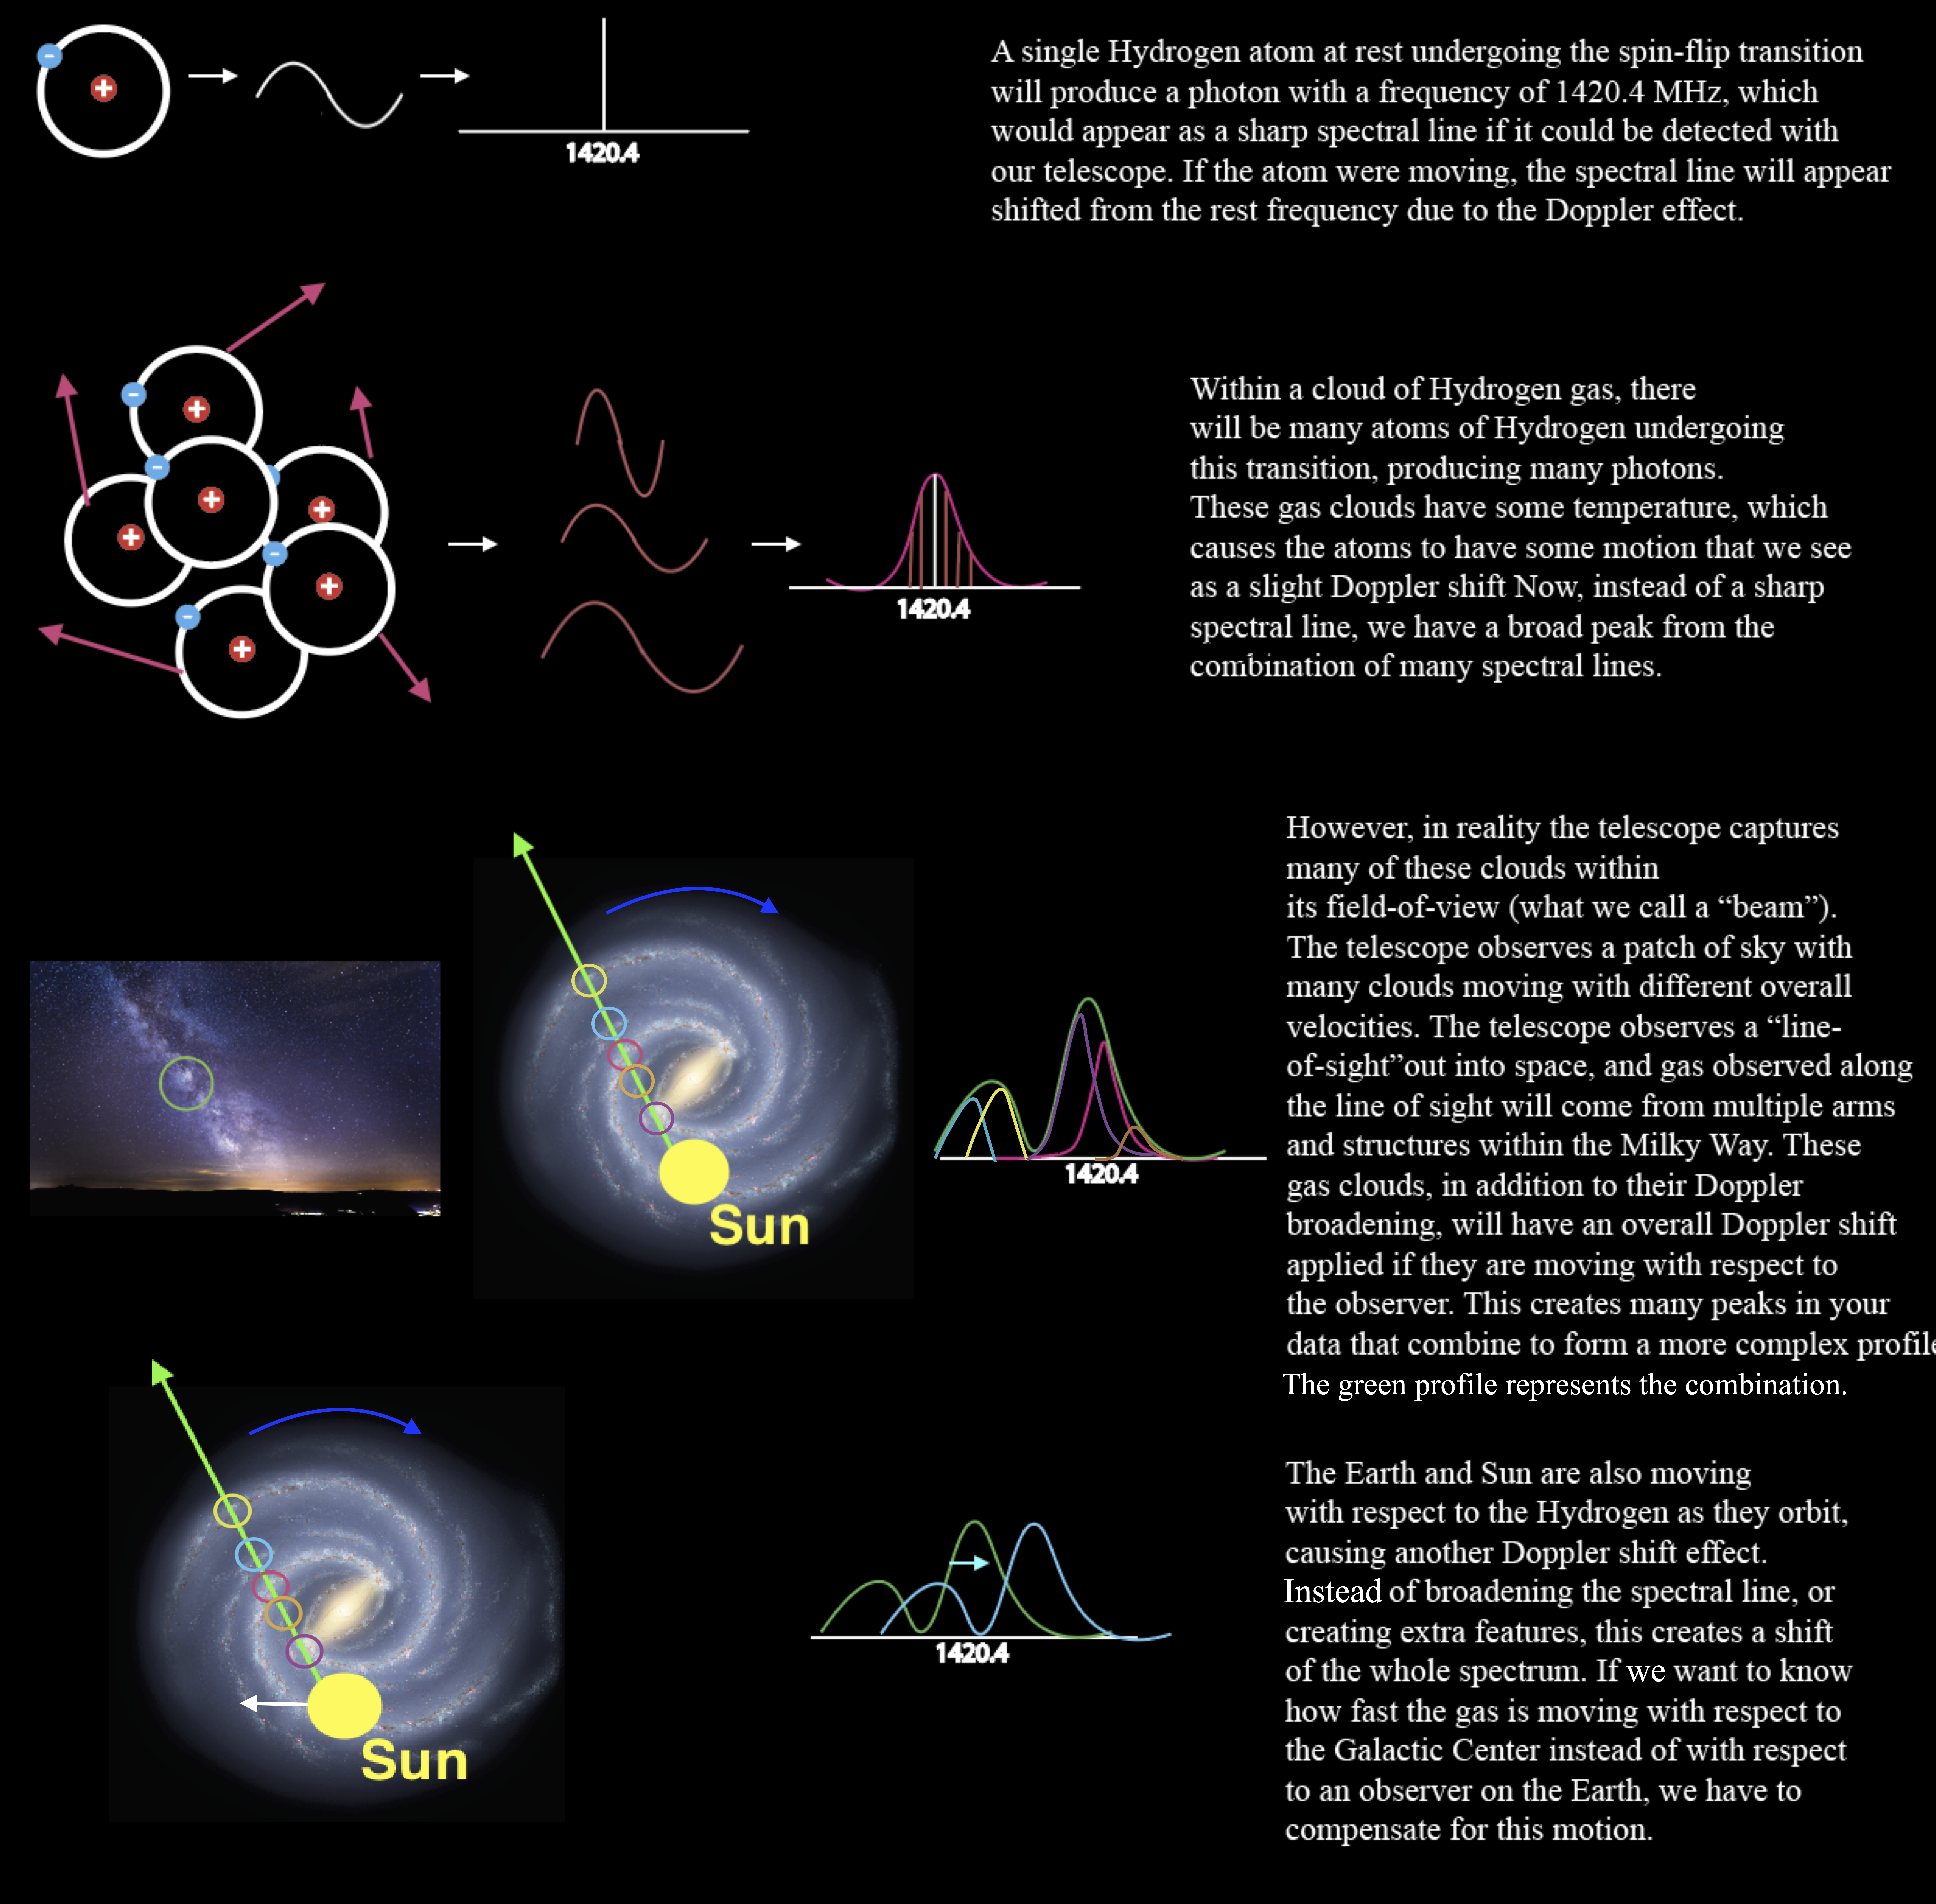
If you have successfully followed the tutorials thus far, you should have a number of data files produced by your CHART. Now, what to do with them? These data files contain your measurements of the Milky Way (or, another target, if you’ve chosen another science case!)– however, these files are raw measurements that won’t look like actual Milky Way spectra quite yet, as they have a number of effects imposed upon them by the environment and the telescope. We’ll start with showing the effects imposed by the physics of the galaxy.

Additionally, there are some effects imposed by the telescope itself, as well as the environment you are observing in on Earth.
We must account for all of these effects in our data in order to make a rotation curve. We will show an example of how to go from the raw CHART data through to a rotation curve using the Python programming language and a tool called a Jupyter notebook. Jupyter is an interactive platform that allows one to write code and see live outputs in a web browser. We will be installing and opening some things in our Terminal. If you are unfamiliar with the Terminal, we reccomend checking out a resource such as FreeCodeCamp to brush up on the basics.
If you have used the CHART image provided for your Raspberry Pi, you will already have Jupyter installed and can skip this step. If you would like to do your analysis on a different machine from the Raspberry Pi, such as a personal computer, you will have to install Assuming you’re familiar with installing packages from the previous steps, to install Jupyter, you can follow the instructions here . If you have a Mac or Linux machine, this should be fairly simple. If you have a Windows machine, you will have to install something like Linux Subsystem for Windows to be able to access the terminal. You can also request an account on the Winona State Jupyter server, which will let you remotely access the Jupyter server without having to install anything on your own machine. If you would like to use this method, please contact one of the team leads.
After installing Jupyter, go to your terminal and type jupyter notebook. This will open a browser with the Jupyter interface. You will need to make sure you are on a machine that has the CHART package installed, following the instructions from the previous tutorials, and that you are on the machine where your data is located. You can move your data from the Pi to a personal computer if needed.
Then, open the tutorial notebooks in your Jupyter browser. These should be copied onto the machine when your install the CHART package. There is an abridged version if you would just like to plot your data and see if you detected the 21-cm line. There is a full tutorial as well if you would like to make a rotation curve.

